xDrip » Features » Display » xDrip Legend
You can customize some xDrip colors at: Settings −> xDrip+ Display Settings −> xDrip+ Color Settings
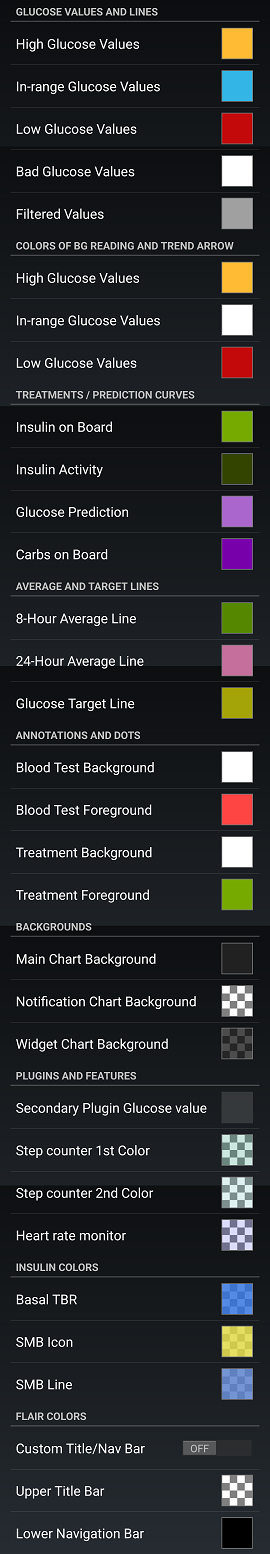
The following image shows the page, without the example chart at the top.
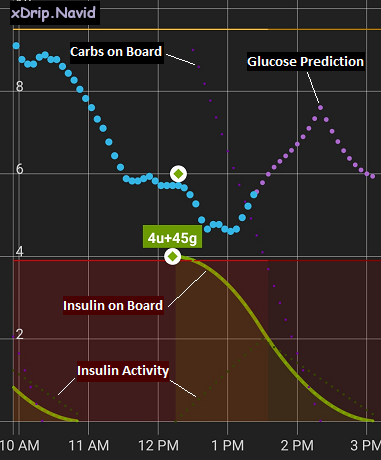
The following image shows a sample main screen with the default treatment/prediction colors and characteristics identified.
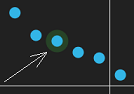
If you enable backfilled data (Settings −> xDrip+ Display Settings −> Graph Settings −> Show backfilled Data), a reading that is backfilled is highlighted as shown in the following figure.
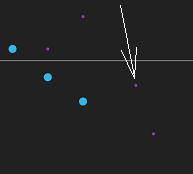
If you are using xDrip as a collector from G6 or G7 and enable Settings −> xDrip+ Display Settings −> Graph Settings −> G6/G7 Predictions, you will see the prediction points as shown below.
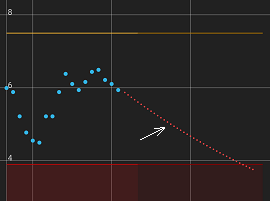
Enabling Forecast Low alert will show the extrapolated curve when a low is predicted as shown in the following figure.